Why H3 Is More Than a Grid System in Climate-Tech
H3 is often introduced as a hexagonal grid system for geospatial analysis. That description is correct, but it is also too narrow. In climate-tech, H3 is not just a way to divide the map. It can also become a foundation for product design, scalable infrastructure, data modelling, and local decision-support. That is why I see H3 as more than a grid system.
At first glance, H3 may look like a technical choice mainly relevant to geospatial engineers. It gives the world a hierarchical set of hexagonal cells and makes it easier to aggregate, index, and compare spatial data. But once you start building climate products with large environmental datasets, H3 becomes much more than a neat geometry.
It starts to shape how data is stored, how maps are explored, how locations are compared, and how products can scale.
Why Climate-Tech Needs Better Spatial Structure
Climate-tech products often depend on data that is both spatial and temporal. Rainfall, drought indicators, temperature anomalies, vegetation signals, flood exposure, soil moisture, and seasonal forecasts all vary by location and by time.
That sounds obvious, but it creates a real product and engineering challenge.
How do you store this information in a way that is consistent across regions?
How do you compare nearby places efficiently?
How do you aggregate up and down between local and broader views?
How do you build interfaces that let users explore conditions without depending entirely on irregular administrative boundaries or raw raster grids?
This is where spatial structure matters.
A lot of environmental data begins as raster or point-based information. That is useful, but many user-facing products need a more flexible spatial unit for analysis, storage, and visualisation. H3 provides that unit in a way that is especially useful for climate-tech.
Why Hexagons Matter
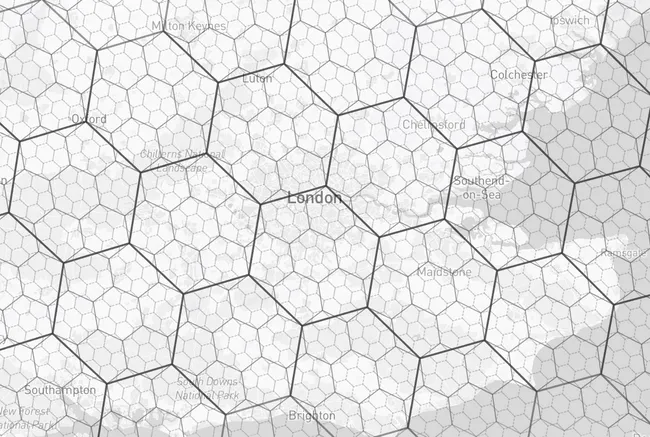
One reason H3 is powerful is that it uses hexagons.
Hexagons tend to work well in spatial analysis because they reduce some of the directional bias that appears in square grids. They also create a more balanced neighbourhood structure. In practical terms, that makes them useful for comparing nearby cells, smoothing patterns, and building visually coherent map products.
For climate-tech, that matters because many environmental patterns are continuous rather than sharply bounded. Drought does not stop neatly at a district line. Rainfall anomalies do not care about administrative borders. Vegetation stress often spreads across landscapes more gradually than human boundaries suggest.
Hexagonal indexing provides a structure that feels closer to how many environmental patterns actually behave.
H3 as a Common Spatial Language
One of the biggest strengths of H3 is that it gives different datasets a shared spatial language.
Once multiple layers are attached to the same H3 cells, it becomes much easier to combine and compare them. Rainfall, SPI, vegetation condition, forecast values, exposure scores, land use summaries, and other variables can all be linked to the same indexed geography.
That changes how products can be built.
Instead of handling every dataset as a separate spatial logic problem, you can work with a common framework. That framework makes joins easier, aggregations cleaner, and product design more coherent. The system becomes easier to scale because every new layer does not require reinventing the geographic structure.
In climate-tech, that kind of consistency is extremely valuable.
Why H3 Is Useful for Product Design
H3 is not only an engineering tool. It can also shape product experience.
This is one of the most underrated aspects of the technology.
In a climate-tech platform, the map is not just a background visual. It is often the main interface through which users interpret conditions. The way data appears spatially affects how easy it is to compare places, notice patterns, and trust what is being shown.
H3 helps create products that are visually consistent and analytically structured at the same time.
For example, if a drought platform uses H3 cells as its map unit, it can display local patterns in a way that is easier to scan and compare than many traditional polygon-based approaches. It can also support clicking, summarising, ranking, and time-based comparison in a more standardised way.
That matters because a product is not only about what data it contains. It is also about how clearly the user can navigate and interpret that data.
Better Than Administrative Boundaries for Many Use Cases
Administrative boundaries are important in many contexts, but they are not always the best primary structure for environmental intelligence.
They vary widely in size and shape. They may reflect governance, but not environmental continuity. They are useful for reporting, yet often awkward for spatial comparison. In product terms, they can also create distorted visual impressions because very large polygons dominate the map even when their internal conditions vary substantially.
H3 does not replace administrative boundaries completely, but it offers a more neutral analytical layer.
That is especially useful in climate-tech, where many questions are about local variation rather than administrative reporting alone. A drought platform, for example, may still need district summaries, but its internal logic can benefit from being built on a stable grid structure first.
This gives more flexibility. You can analyse by H3 cell, then aggregate into administrative units later if needed. That is often easier than starting with administrative units and trying to recover local spatial variation afterward.
Why H3 Helps with Scalability
Scalability is another reason H3 matters far beyond geometry.
Climate-tech products often grow quickly in complexity. What begins as one variable and one geography can expand into multiple indicators, time periods, scenarios, forecast layers, and user needs. If the underlying spatial model is messy, that growth becomes difficult to manage.
H3 helps because it is hierarchical and index-based.
Each cell has a stable identifier. Cells can roll up into coarser levels or expand into finer ones. That makes it easier to support multiple zoom levels, multiple reporting scales, and multiple product features without constantly redesigning the spatial framework.
For a startup or product team, this is important. Good infrastructure choices reduce friction later. H3 is one of those choices that can make a platform more scalable both technically and conceptually.
Why It Works Well with Modern Data Stacks
Another reason I see H3 as more than a grid system is that it fits naturally with modern cloud-native and analytics-friendly data stacks.
H3 indexes work well inside tabular systems such as DuckDB, Postgres/PostGIS, Parquet pipelines, and GeoParquet-based workflows. That means climate-tech teams can treat spatial data more like analytical data without losing geographic meaning.
This is a big deal.
Instead of always relying on heavyweight spatial processing pipelines, teams can increasingly handle climate layers as indexed records tied to H3 cells. That makes it easier to filter, group, join, and query environmental indicators across time and place. It also works well with browser-based analytics, object storage architectures, and serverless-style product design.
This is part of why H3 has become attractive not just to GIS specialists, but to modern data-product teams as well.
H3 and Local Decision-Support
One of the most interesting roles for H3 in climate-tech is local decision-support.
Many climate questions are really place-based questions.
How dry is this area compared with nearby places?
How unusual is this signal here?
Which neighbouring cells show similar stress?
How does this location compare over time?
Which local areas deserve closer attention?
H3 helps support those kinds of questions because it creates a repeatable and comparable local unit. It becomes easier to generate summaries, identify hotspots, compare neighbours, and build local reporting logic without depending on inconsistent shapes.
That is why I find H3 particularly useful in drought and climate-risk products. It helps connect environmental data with local interpretation in a way that is both analytical and user-friendly.
Why It Matters for Founders and Product Builders
From a founder or product-builder perspective, H3 matters because it is one of those infrastructure choices that can quietly improve many parts of a product at once.
It can improve consistency.
It can improve scalability.
It can improve how multiple datasets fit together.
It can improve local exploration.
And it can improve the clarity of the map experience.
These are not small advantages. They affect whether a climate-tech platform feels fragmented or coherent.
This is why I think H3 should not be seen only as a technical implementation detail. In the right product, it becomes part of the business logic. It helps shape what kind of platform can exist, how efficiently it can operate, and how well users can interact with its data.
That is much closer to infrastructure strategy than to simple mapping technique.
H3 as a Product Choice
To me, this is the most important point.
Choosing H3 is not only a decision about geometry. It is a decision about how you want a product to behave.
It is a choice about standardisation, comparison, extensibility, and interaction. It creates a spatial model that is easier to build on over time. And in climate-tech, where products often need to combine multiple datasets, multiple timeframes, and multiple levels of interpretation, that matters enormously.
So yes, H3 is a grid system.
But in climate-tech, it can also be:
- a common modelling layer
- a product design enabler
- a scalable data structure
- a local intelligence framework
- and a foundation for better environmental tools
Closing Thoughts
H3 is often described in technical terms, but its value in climate-tech goes much further than spatial indexing alone.
It helps create a common structure for complex environmental data. It supports clearer map products, better local comparison, more scalable infrastructure, and more flexible decision-support tools. It fits naturally with modern data stacks and helps turn messy spatial complexity into something more product-ready.
That is why I see H3 as more than a grid system.
In the right climate-tech product, it becomes part of the platform’s deeper logic — not just how the map looks, but how the product works.