Inside Drought.UK: Met Office Grids, ECMWF Forecasts, DuckDB and H3

Inside Drought.UK: Met Office Grids, ECMWF Forecasts, DuckDB and H3
Drought is often described as a slow-moving hazard, but on the ground its effects can arrive with real urgency. For farmers, water managers, local authorities and infrastructure planners, the key challenge is not only understanding what has already happened, but also seeing how conditions are changing and what may come next.
That is the purpose of Drought.UK. The platform is being developed to help users explore drought conditions across the United Kingdom through practical, map-based tools built on modern geospatial and data engineering methods. Behind the interface sits a technical stack that combines UK rainfall grids, ECMWF seasonal forecasts, indicator calculation pipelines, DuckDB analytics and H3 hexagonal spatial indexing.
Why Drought.UK Matters
The UK is not always the first place people associate with drought, yet dry spells, rainfall deficits and longer-term water stress can create serious pressure across agriculture, ecosystems, reservoirs and water supply systems. These risks are often unevenly distributed, which makes local analysis especially important.
A drought platform therefore needs to do more than show a single rainfall map. It must bring together historical conditions, anomalies, standardised drought indicators and future-looking forecasts in a way that is understandable and useful. Drought.UK is being designed with exactly that goal in mind.
The Core Datasets Used in Drought.UK
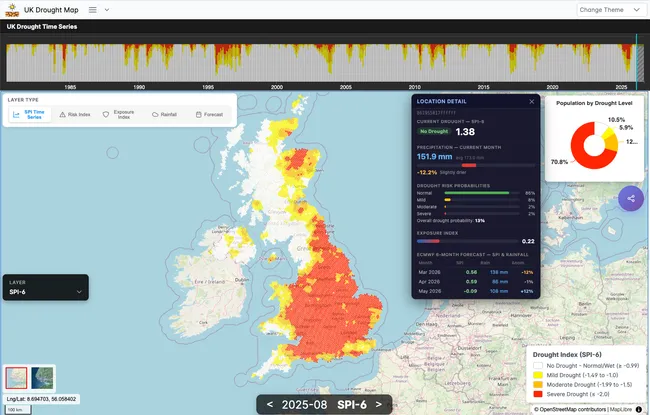
At the heart of Drought.UK are UK gridded rainfall datasets based on Met Office data products. These grids provide the foundation for monitoring observed rainfall conditions across the country and support consistent spatial analysis beyond the limitations of station-only views.
Using gridded data is important because drought rarely follows neat administrative boundaries. Local conditions can vary significantly even within the same county or region. A gridded approach makes it possible to analyse rainfall deficits more continuously and more fairly across the landscape.
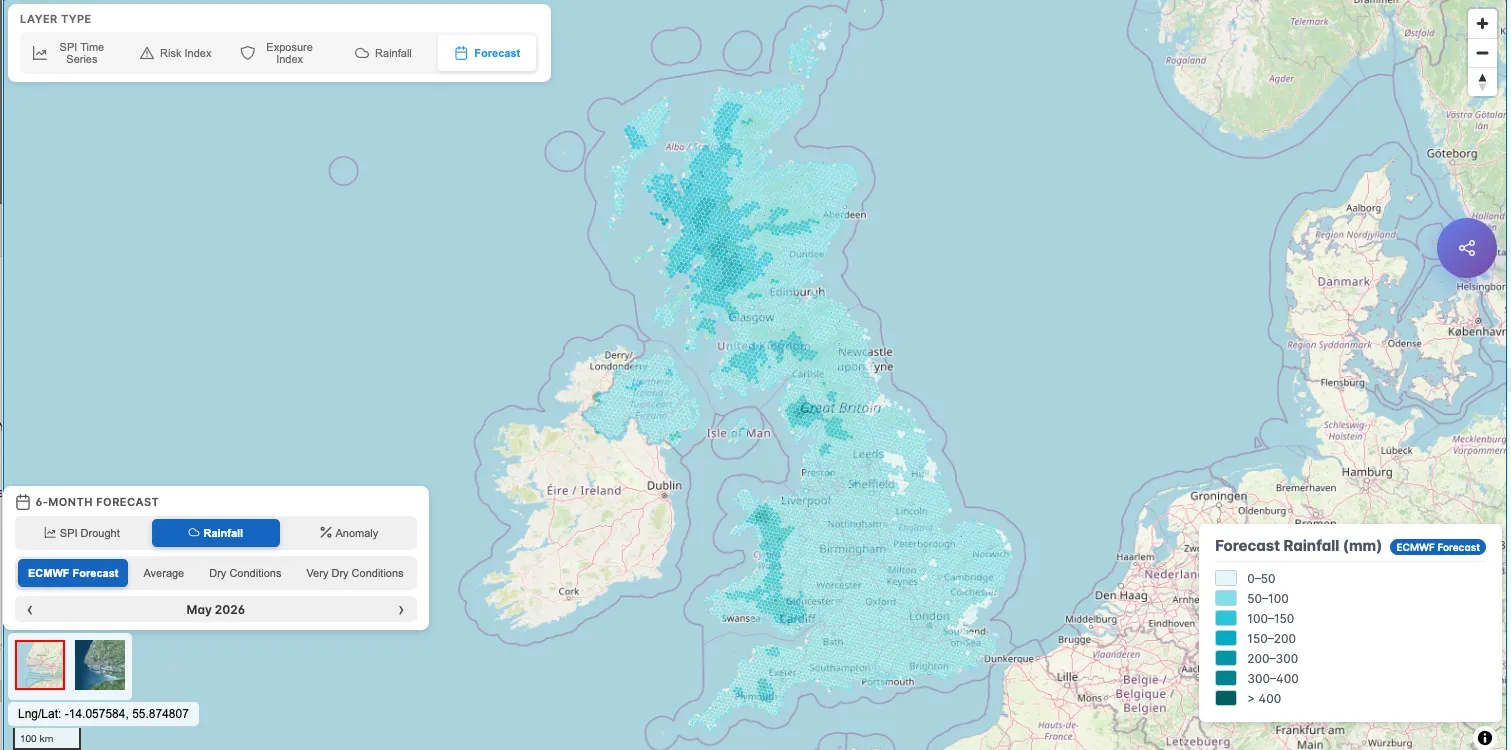
Alongside these observed rainfall datasets, Drought.UK also uses ECMWF seasonal forecast products. This is a major step because it allows the platform to move beyond retrospective monitoring and support forward-looking drought analysis. Instead of only showing what has happened, the system can also help users assess what the next months may look like.
The ECMWF seasonal component currently supports six-month forecast views, including the current month. In practical use, the first one or two months are often the most decision-relevant, while later months can still provide useful directional signals. These forecasts are updated monthly, giving the platform a regularly refreshed planning layer.
From Raw Data to Drought Indicators
Raw climate data does not become useful simply by being placed on a map. It has to move through a proper calculation pipeline so that users can interpret it in context.
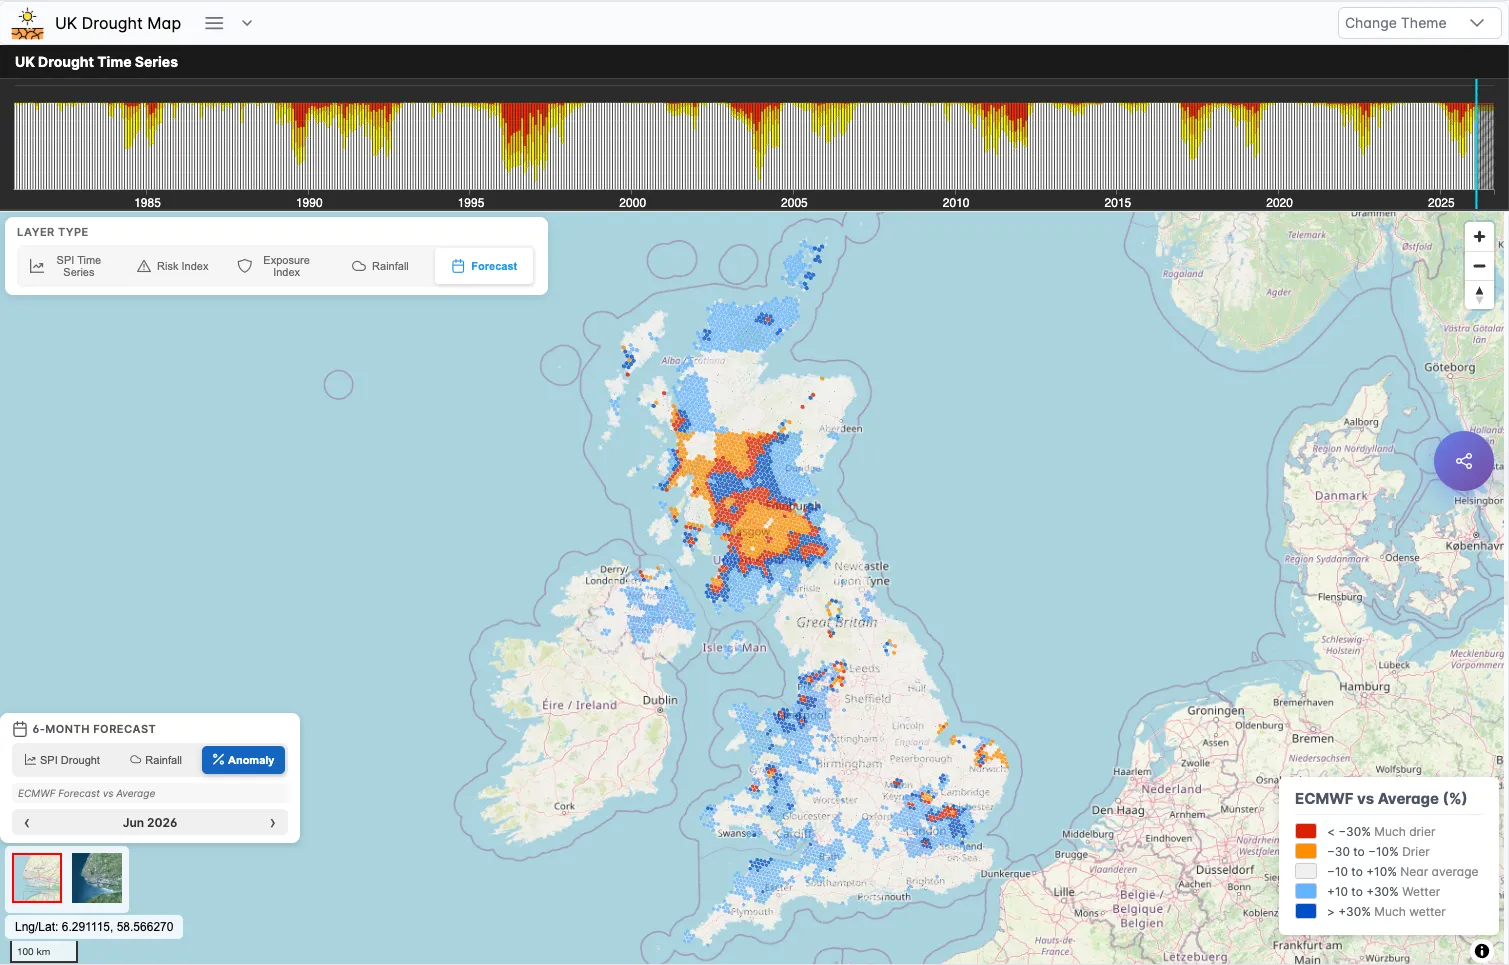
In Drought.UK, the pipeline begins with collecting and organising rainfall grids and forecast datasets. These inputs are then processed into monthly totals, rolling summaries and long-term baseline comparisons. From there, anomaly layers can be calculated to show how current or forecast rainfall compares against historical norms.
One of the most important products in this workflow is SPI, or the Standardized Precipitation Index. SPI helps translate rainfall deficits into a statistically interpretable drought signal. Rather than simply saying rainfall was low, SPI helps show how unusual that low rainfall is for the location and the season.
This makes a big difference in practice. A dry month in one area may be far more abnormal than the same rainfall amount in another area. SPI helps standardise that comparison.
The same logic extends into seasonal forecast processing. ECMWF rainfall forecasts can be transformed into projected anomalies and forecast drought indicators, helping users explore how developing conditions may unfold if dry patterns continue.
Scenario-Based Planning
A particularly practical part of Drought.UK is its scenario-based approach. Rather than depending on a single forecast interpretation, the platform can present multiple rainfall assumptions such as average precipitation, 80 percent of average and 70 percent of average rainfall.
These scenarios are useful because they turn climate data into planning logic. A user can ask not only what the forecast suggests, but also what conditions may look like under slightly more cautious or more stressed rainfall assumptions. This is especially relevant for agriculture, water management and resilience planning, where decisions often need to account for uncertainty.
Why H3 Is Important to the Project
One of the defining technical choices in Drought.UK is the use of H3.
H3 is a hierarchical hexagonal spatial indexing system that provides a powerful way to organise and visualise geospatial information. In Drought.UK, H3 helps create a consistent spatial framework for storing, analysing and presenting drought-related indicators.
There are several reasons this matters.
Hexagons offer a visually balanced and analytically useful geography for comparing neighbouring areas. They also reduce some of the directional bias often associated with square grids. More importantly, H3 gives every cell a stable spatial identifier, which makes it easier to connect rainfall, anomaly, SPI and exposure-related outputs to the same geographic unit.
This gives Drought.UK a shared spatial language. Different datasets and calculation outputs can be aligned, queried and visualised within the same indexed structure. That makes the platform easier to scale and easier to maintain as new layers are added.
DuckDB and the Analytical Backbone
If H3 provides the spatial structure, DuckDB provides much of the analytical backbone.
DuckDB is a lightweight but very powerful analytical database engine, well suited to climate and geospatial workflows that involve large tabular datasets, time-series calculations and repeated aggregation. For Drought.UK, this is especially valuable because drought analysis often requires comparing many locations, many time periods and multiple indicators in a fast and flexible way.
DuckDB works particularly well with columnar formats such as Parquet, which makes it a strong fit for modern climate-tech pipelines. When combined with H3-indexed data, it allows the project to run efficient filtering, grouping, joins and indicator preparation without relying on unnecessarily heavy infrastructure.
This is one of the reasons the project can remain both technically modern and operationally practical. The goal is not complexity for its own sake, but a system that can process serious environmental data while staying lean and maintainable.
The Relationship Between DuckDB and H3
The combination of DuckDB and H3 is one of the most interesting parts of the Drought.UK architecture.
H3 provides the indexed spatial unit. DuckDB provides the fast analytical engine for working across those units. Together, they make it possible to move efficiently from raw gridded rainfall data to map-ready drought layers.
For example, rainfall summaries can be connected to H3 cells, anomaly values can be aggregated or joined by cell and time period, and SPI outputs can be stored and queried in a way that is both compact and scalable. This relationship between spatial indexing and analytical querying helps the platform stay responsive as datasets grow.
Building a Platform That Can Evolve
Drought.UK is not intended to remain a static rainfall viewer. Its architecture is being built so that additional indicators, forecast products and decision-support layers can be added over time.
That could include more exposure-oriented layers, new environmental indicators, richer local summaries and additional tools that help users interpret what drought means for their own area. The strength of the project lies in the fact that its technical structure is modular. Met Office grids, ECMWF products, H3 indexing and DuckDB analytics are not isolated components. They work together as part of an expandable calculation system.
Turning Data Engineering into Usable Intelligence
Most users of Drought.UK do not need to know the details of climate file formats, database engines or spatial indexing methods. What matters to them is whether the platform helps answer real questions.
Is this area drier than normal?
How unusual is the current rainfall deficit?
What do the next few months look like?
How does my location compare with nearby areas?
That is where the technical architecture supports public value. Better pipelines, better indexing and better analytics make it possible to deliver simpler and more useful outputs to the people who need them.
Closing Thoughts
Drought.UK is, in many ways, as much a data pipeline project as a mapping project. The visible maps are only one part of the story. Behind them sits a structured workflow built from Met Office rainfall grids, ECMWF seasonal forecasts, drought indicator calculations, H3 spatial indexing and DuckDB-powered analysis.
Together, these components help create a modern drought intelligence platform for the United Kingdom: one that is designed not only to monitor current conditions, but also to support more local, more detailed and more forward-looking decision-making.
To explore the platform, visit Drought.UK.